Azure Stream Analytics - Alerts on IoT telemetry
Overview
Hello 👋 , In this blog post, I'm going to walk through to create stream-processing logic using Azure Stream Analytics to gather data from the Internet of Things(IoT) devices. In detail, I will explain the alert handling queries in Azure Stream Analytics to trigger an alert when the threshold is reached, clear the alert when telemetry is out of the alert, and other alert handling scenarios.
Setting up Azure Stream Analytics
To set up Azure Stream Analytics, you need an Azure account. If you don't have one, create a free Azure account here.
You can set up Azure Stream Analytics from Azure Portal or CLI or other IaC (Infrastructure as Code) tools. I would recommend installing the Azure Stream Analytics Tool extension in Visual Studio Code for development and testing purposes. Please follow this documentation to set up an Azure Stream Analytics Job.
IoT Telemetry & Alert Handling - Scenario
Now, let's talk about IoT Telemetry and the Alert handling scenarios. Consider the industrial automation company that has machinery in a plant that has sensors that are emitting streams of data in real-time. In this scenario, the plant manager wants to have real-time insights from the sensor data and take action on when the alert happens. You can configure the thresholds and detect whether the measurement values are over the threshold to identify alerts. In this blog, we will consider the sensor measurement values are - Temperature & Humidity.
We are going to write an Azure Stream Analytics (ASA) query to identify alerts with the following requirements.
- Identify the alert when the measurement values are over the threshold.
Send Alert event to EventHub or ServiceBus Topic to process.
- Design Goal: The alert has to be sent only when the measurement value crosses the threshold and not spam the user with email alerts.
For e.g, if the temperature is greater than the threshold of 80 and the below data, the alert should happen at the second record only and not on every record.
{ "time": "2021-08-20T20:47:53", "temp": "78",... "deviceId": "sensor-001" }
{ "time": "2021-08-20T20:47:54", "temp": "86",... "deviceId": "sensor-001" }
{ "time": "2021-08-20T20:47:55", "temp": "81",... "deviceId": "sensor-001" }
Send "Alert Cleared" event when the device is back to normal.
- Send "Escalated" event when the device is in alert for configured escalation duration.
Let's see what are the options available in ASA query patterns to implement the above requirements.
Detecting Alerts in Telemetry
First, we will create a pass-through query that passes all input data to the output. In this, I've used limited data as sample JSON for clarity while developing. Please download the data from here if you wish to use the same.
SELECT
    *
INTO
    [output]
FROM
    [deviceTelemetry]
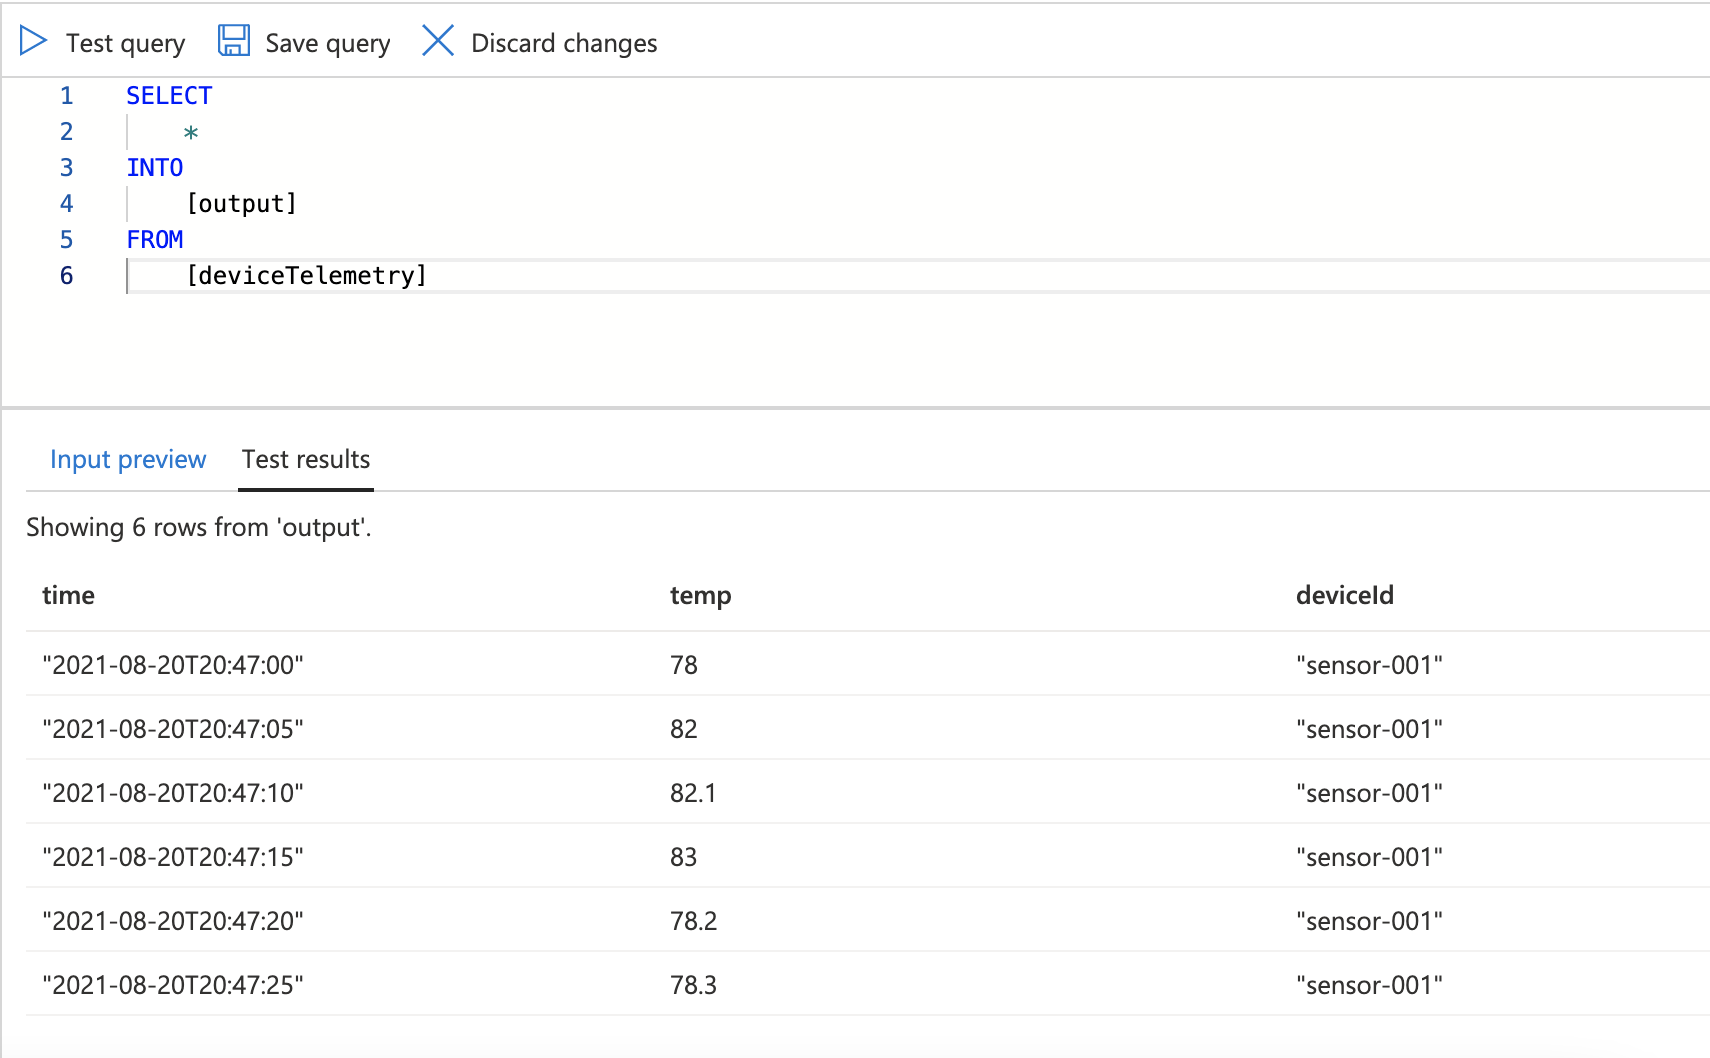
The test results will be
Now, let's apply the analytics to find the alert when the temperature is greater than 80. The output of the query has the hasAlert flag that denotes whether the telemetry is in alert or not.
- Please note, we can use reference input to apply the rules dynamically instead of hardcoding threshold values in stream analytics query. For brevity of this blog, please refer here on how to do reference inputs for query or I'll cover in another blog post.
WITH ProcessedTelemetry as (
    SELECT
        deviceId,
        System.timestamp() as time,
        AVG(temp) as temp,
        CASE WHEN AVG(temp) > 80 THEN 1 ELSE 0 END as hasAlert
    FROM
        [deviceTelemetry] TIMESTAMP BY time
    GROUP BY
        System.Timestamp(), deviceId -- Run immediately on every event or use any temporal window here
)

SELECT * FROM ProcessedTelemetry
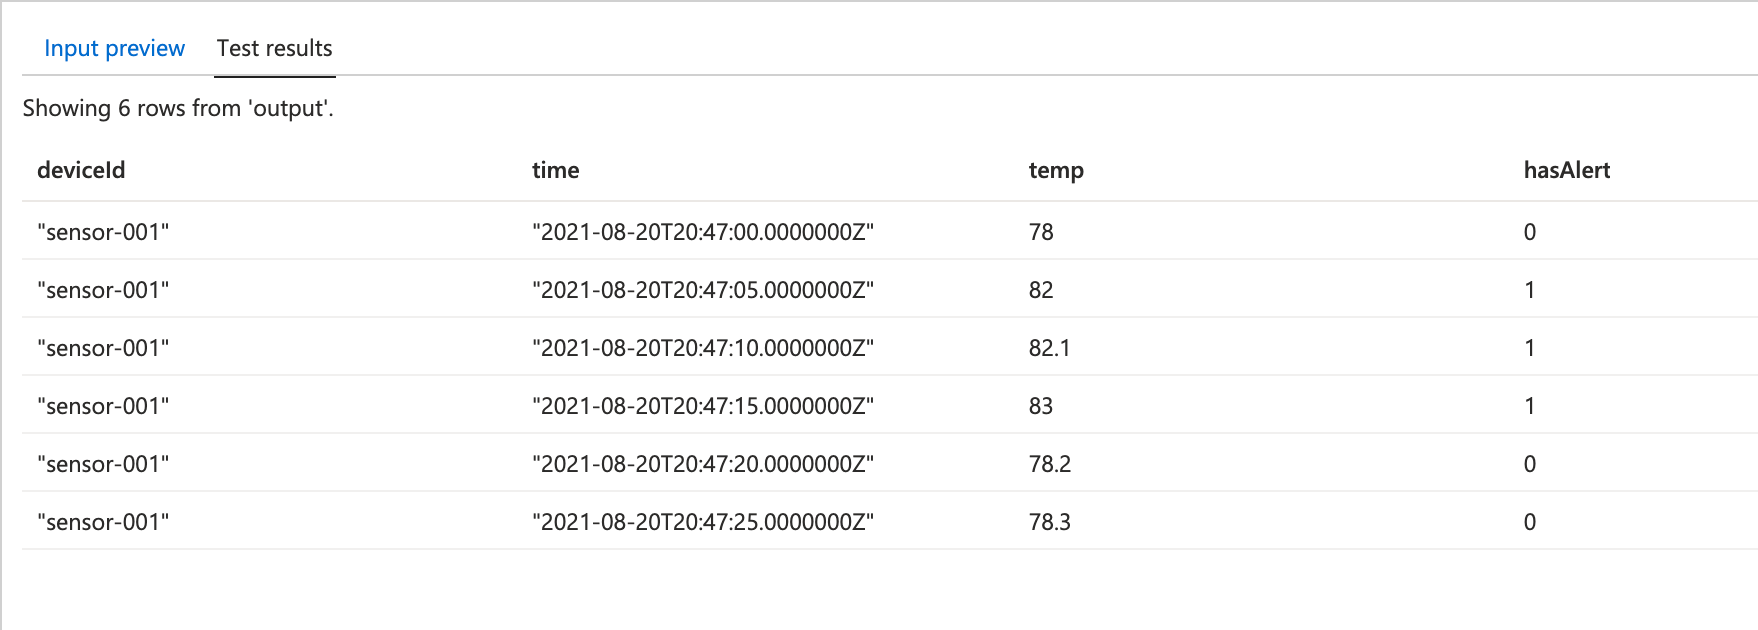
Good !! Now we know what are the events has alert or not. We need to send an alert only when the telemetry is entered into the alert status. In the above table, it has to be the second row where the device gets into alert. Let's take a look what are the analytical functions in ASA Query to identify the previous event.
LAG - The LAG analytic operator allows one to look up a “previous” event in an event stream, within certain constraints. It is very useful for computing the rate of growth of a variable, detecting when a variable crosses a threshold, or when a condition starts or stops being true.
In the below query, we are using the LAG function with a day scope to find the previous event hasAlert field in the telemetry. If you execute the results, you can see both hasAlert and previousAlert fields. previousAlert tells what's the previous hasAlert field in the stream.
WITH ProcessedTelemetry as (
    SELECT
        deviceId,
        System.timestamp() as time,
        AVG(temp) as temp,
        CASE WHEN AVG(temp) > 80 THEN 1 ELSE 0 END as hasAlert
    FROM
        [deviceTelemetry] TIMESTAMP BY time
    GROUP BY
        System.Timestamp(), deviceId -- Run immediately on every event
),
TelemetryWithLastAlert as (
    SELECT
        deviceId,
        time,
        temp,
        hasAlert,
        LAG(hasAlert) OVER (PARTITION BY deviceId LIMIT DURATION(day, 1)) as previousAlert
    FROM
        ProcessedTelemetry
)

SELECT * FROM TelemetryWithLastAlert

So to detect the event exactly when the device entered into the alert state is easy to query by comparing hasAlert and previousAlert state.
WITH ProcessedTelemetry as (
    SELECT
        deviceId,
        System.timestamp() as time,
        AVG(temp) as temp,
        CASE WHEN AVG(temp) > 80 THEN 1 ELSE 0 END as hasAlert
    FROM
        [deviceTelemetry] TIMESTAMP BY time
    GROUP BY
        System.Timestamp(), deviceId -- Run immediately on every event
),
TelemetryWithLastAlert as (
    SELECT
        deviceId,
        time,
        temp,
        hasAlert,
        LAG(hasAlert) OVER (PARTITION BY deviceId LIMIT DURATION(day, 1)) as previousAlert
    FROM
        ProcessedTelemetry
)

SELECT
    deviceId,
    time,
  temp,
  hasAlert
INTO
    alertHub
FROM
    TelemetryWithLastAlert
WHERE
    hasAlert = 1 AND (previousAlert IS NULL OR previousAlert = 0)

So far, we've seen #1 and #2 of our requirements - Detecting the alert state in telemetry and trigger an event to hub or service bus topic only when the state got changed into alert from normal.
Alert Cleared Events
As we've both the current alert state and previous alert state is available, we can do a similar query to identify when the device is back to its normal state.
...
AlertEvents as (
    SELECT
        deviceId,
        time,
        temp,
        hasAlert,
        'alertRaised' as eventType
    FROM
        TelemetryWithLastAlert
    WHERE
        hasAlert = 1 AND (previousAlert IS NULL OR previousAlert = 0)

    UNION

    SELECT
        deviceId,
        time,
        temp,
        hasAlert,
        'alertCleared' as eventType
    FROM
        TelemetryWithLastAlert
    WHERE
        hasAlert = 0 AND previousAlert = 1
)

SELECT *  INTO alertHub FROM AlertEvents
The test results will be

Alert Escalated Events
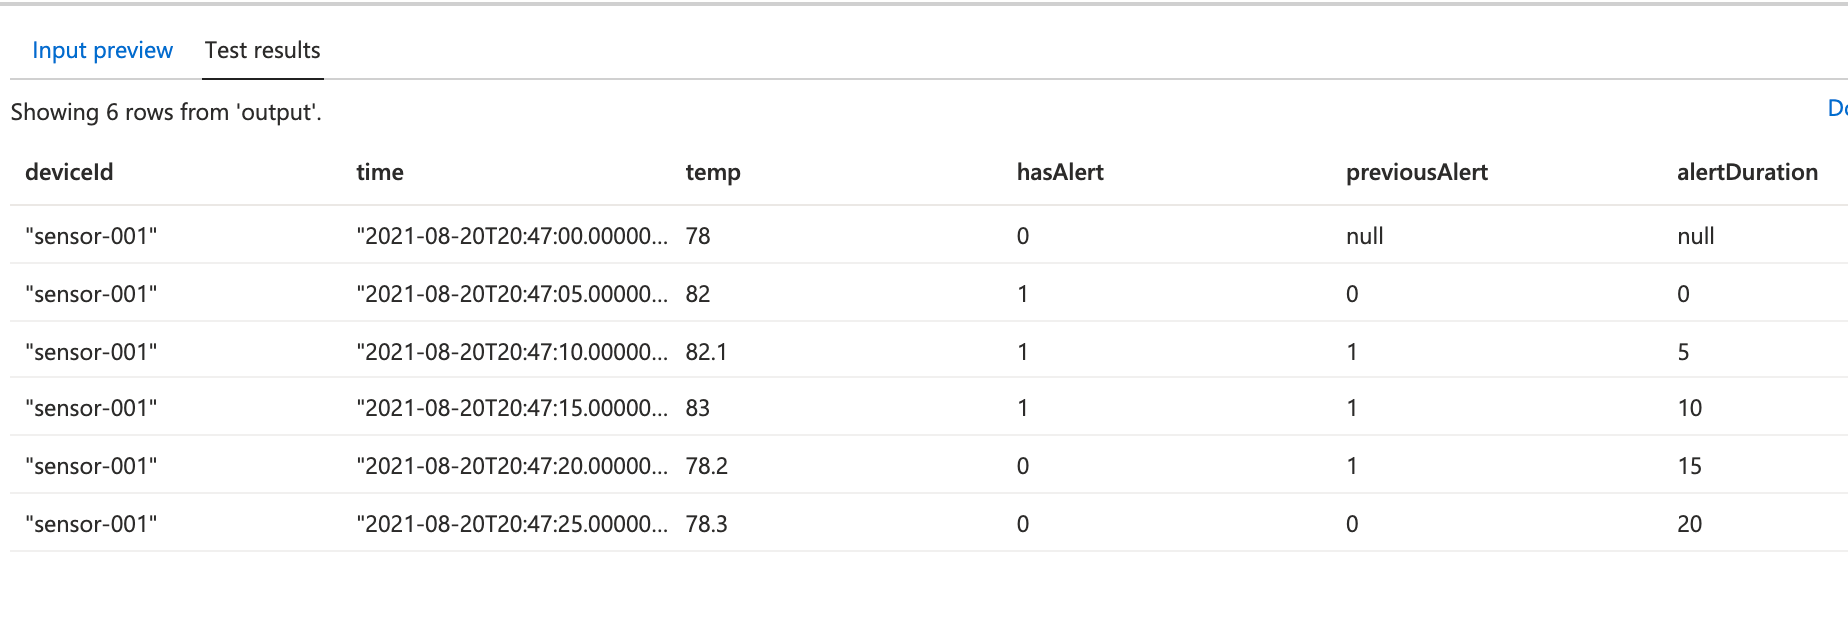
To implement a final item in the requirements, the final item is - to escalate the alert after the threshold interval. Here, we are using LAST analytics query to find the time where the alert started and finding the duration of the alert - so we can escalate event when the device is alert state more than configured threshold. You can extend the query - to find the last escalation duration to emit events only when the alert is escalated. I leave it here for your exercise to extend it further.
LAST
The LAST analytic operator allows one to look up the most recent event in an event stream within defined constraints. It is useful in the scenarios like computing last known good value (e.g. not null), finding last time when event matched certain criteria, etc.
TelemetryWithDuration as (
    SELECT
        deviceId,
        time,
        temp,
        hasAlert,
        previousAlert,
        DATEDIFF(second,LAST(time) OVER (PARTITION BY deviceId LIMIT DURATION(day, 1) WHEN hasAlert = 1 AND previousAlert = 0), time) as alertDuration
    FROM
        TelemetryWithLastAlert
),
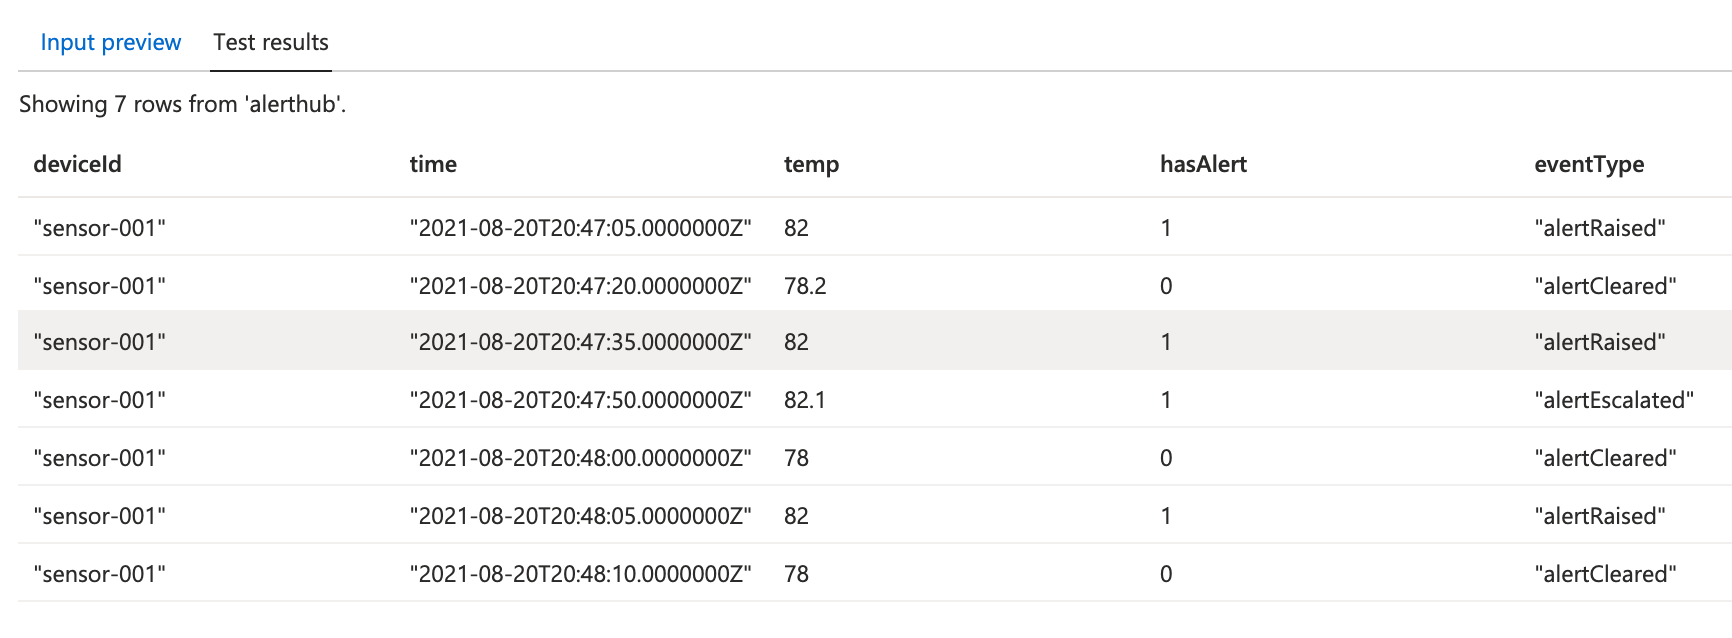
Please check out the repo here:
Sample of complete query results:
Conclusion
In conclusion, Azure Stream Analytics Query provides the ability to process complex events in real-time by real-time analytics. We can use the extensive analytics functions to achieve the result we want by doing real-time analytics in the IoT streaming data. In this blog post, we explored the alert handling scenarios - Detect Alerts, Alert Cleared and Alert Escalated events to be processed by event hub or service bus topics.
I am going to write a lot about cloud, containers, IoT, and Devops. If you are interested in any of that, make sure to follow me if you haven’t already. Please follow me @ksivamuthu or check out my blogs at https://blog.sivamuthukumar.com.
